R’s shiny library is incredible. It’s a library that allows you to build web applications in the R environment. You can create highly interactive data-driven documents and plug them straight into web pages, dashboards, or RMarkdown reports. It’s possible to build your apps with highly interactive and customizable plots, graphs, or maps when shiny is coupled with other libraries like leaflet and ggplot2. The sky’s the limit! I use RStudio, which so far has allowed me to bridge statistical analyses and interactive web applications. Below you can review several recent projects I’ve built. If you have any questions or concerns, feel free to reach out.
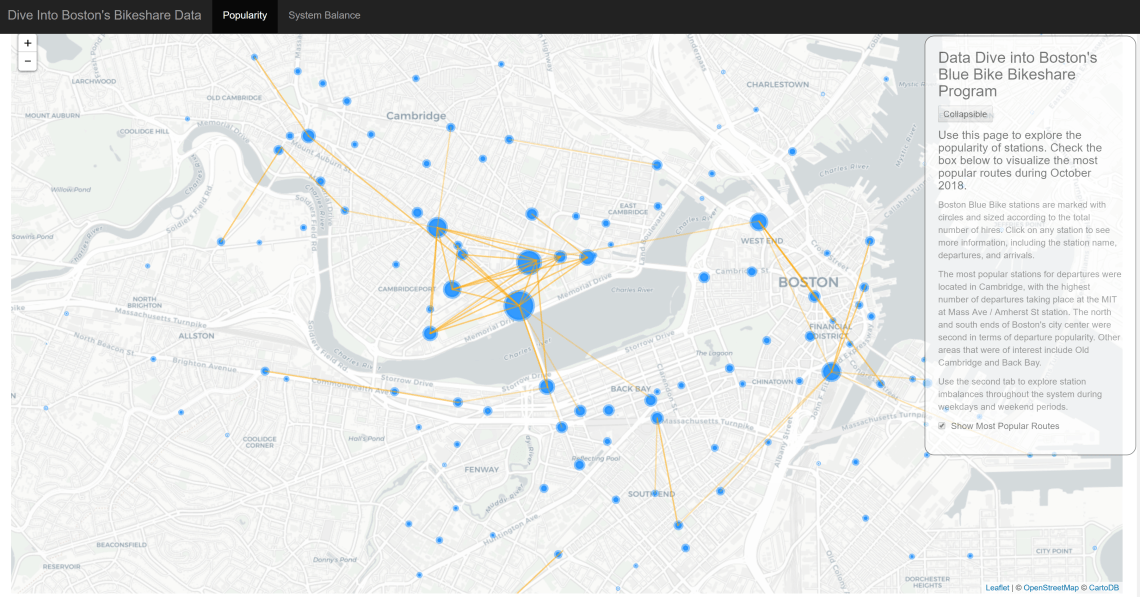
Boston’s Bluebikes Data Exploration Tool
This data-driven tool was designed with exploration in mind. It’s intended for the reader to become rapidly familiar with bike departures and arrivals within the Boston Bluebikes bikeshare system using data from October 2018. It’s a tool for analyzing the popularity of hires from an individual station standpoint. It’s also useful to answer the question, “Where might the bike share system have a rebalancing problem?”. This tool could be used to address this problem in Boston. You can open the app via the link below to dive into the Boston Blue Bike data yourself. There’s even an option to visualize desire lines between the most popular stations.
View a live demo of the tool in action.
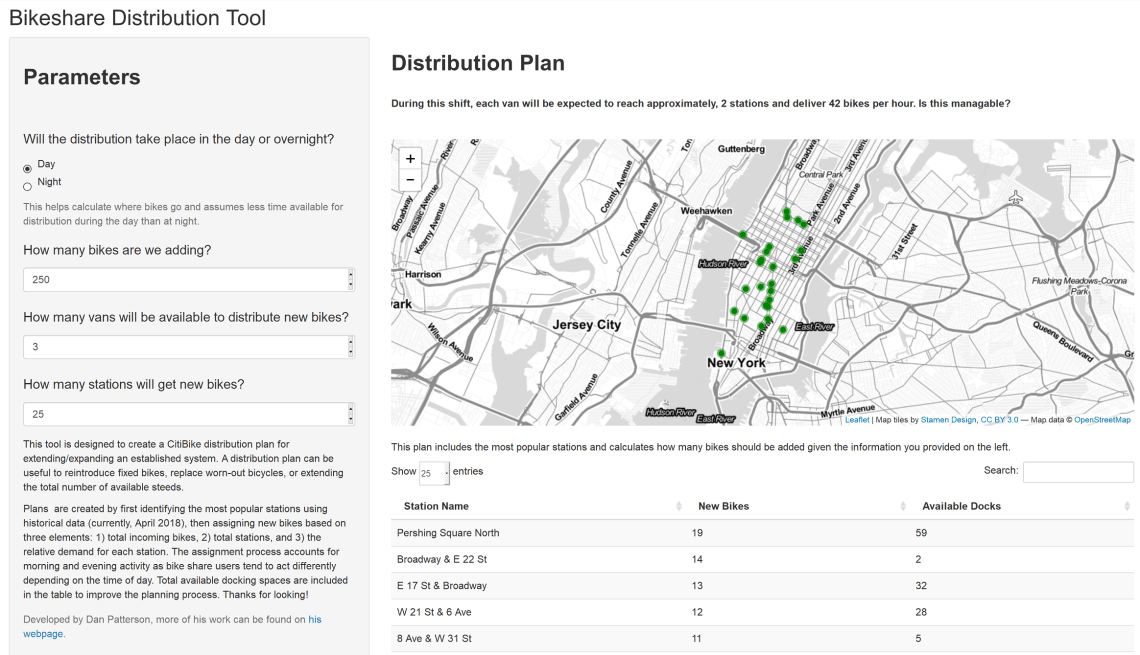
Bikeshare Bike Distribution Tool
This tool is designed to help create a distribution plan for the Citibike bikeshare program. It’s intended to assist field operators to find stations for bikes in real time. Whether the bikes are new or replacements, this tool helps locate the stops most likely to be used by the public to further distribute bikes into the system.
A distribution plan can be useful to reintroduce fixed bikes, replace worn-out bicycles, or extending the total number of available steeds. The tool creates a plan by first identifying the most popular stations using historical data (currently, April 2018), then assigning new bikes based on three elements: 1) total incoming bikes, 2) total stations, and 3) the relative demand for each station. The assignment process accounts for morning and evening activity as bike share users tend to act differently depending on the time of day. Total available docking spaces are included in the table to improve the planning process.
This is an ongoing project, so recommendations are welcome, just use this page to contact me. My next step is to build in a download button to get the table data. Thanks for looking!
Here’s a demo of the tool in action.